
Selected: Edexcel A Level Maths - Pure Maths
AS & A2 (Whole Course) - All Questions - Casio fx-991EX
Register / Login for More / Subscribe for All Without Ads
AS & A2 (Whole Course) - All Questions - Casio fx-991EX
Register / Login for More / Subscribe for All Without Ads

Explore translations of a graph
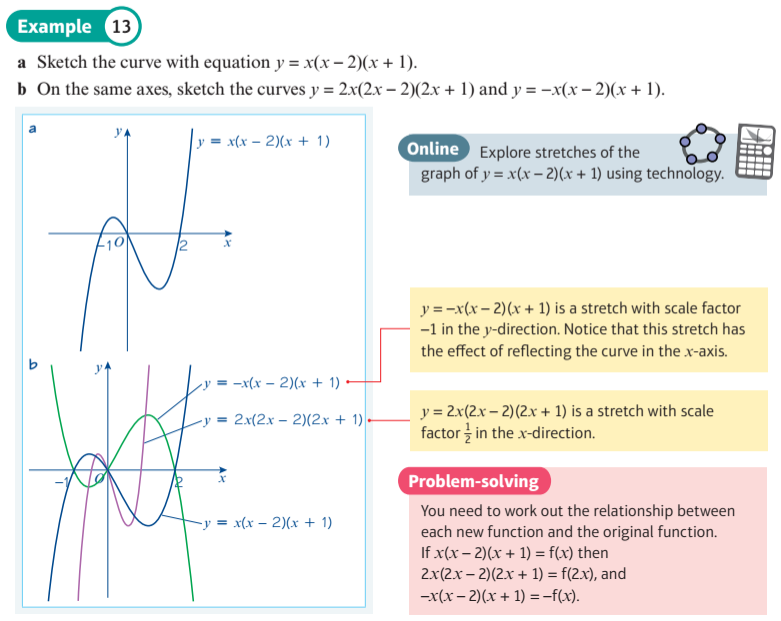
Explore stretches of a cubic graph
Explore transformations of exponential function
Explore combined tranformations of logarithms
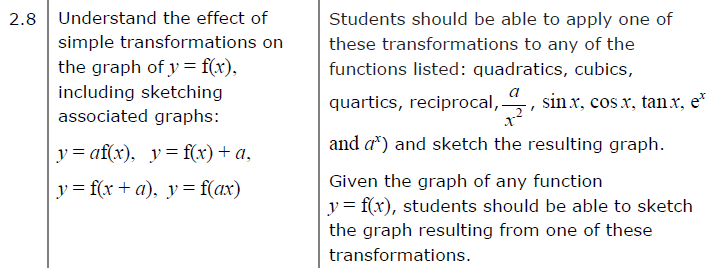
Transformation: y = a f(x)
For each example, investigate the effect on the graph of y = af(x) of changing 'a'.
A transformation may look like a rotation, but the draggable green point, shows they are all, in fact, stretches away from the x-axis by a factor of a.
What is the effect of making a = -1, so y = -f(x) ?
A transformation may look like a rotation, but the draggable green point, shows they are all, in fact, stretches away from the x-axis by a factor of a.
What is the effect of making a = -1, so y = -f(x) ?
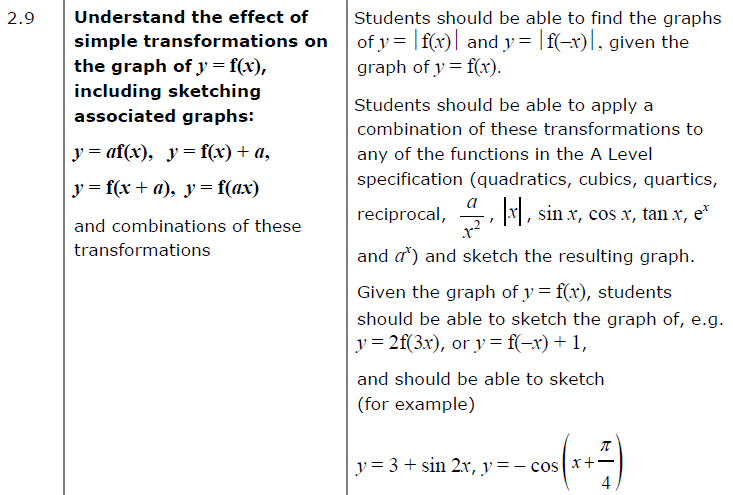
Transformation: y = f(x + a)
For each example, investigate the effect on the graph of y = f(x + a) of changing 'a'.
The green sample points show how graphs are translated horizontally in the opposite direction to what you might expect.
The green sample points show how graphs are translated horizontally in the opposite direction to what you might expect.
Transformation: y = f(x - a)
For each example, investigate the effect on the graph of y = f(x - a) of changing 'a'.
The green sample points show how graphs are translated horizontally.
The green sample points show how graphs are translated horizontally.
Transformation: y = f(x) + a
For each example, investigate the effect on the graph of y = f(x) + a of changing 'a'.
You can drag the green point, and then use the slider to see the effect of the transformation on that particular point.
You can drag the green point, and then use the slider to see the effect of the transformation on that particular point.
Transformation: y = f(a x)
For each example, investigate the effect on the graph of y = f(ax) of changing 'a'.
The green sample points show how graphs expand or contract horizontally in the opposite directions to what you might expect.
What is the effect of making a = -1, so y = f(-x) ?
The green sample points show how graphs expand or contract horizontally in the opposite directions to what you might expect.
What is the effect of making a = -1, so y = f(-x) ?
Exponential and Log Combined Transformations
Two transformations of \(y = f\left( x \right)\) are considered: \(y = f\left( {ax} \right)\) and \(y = f\left( {x - b} \right)\) , together with their combination.
This display shows the transformation \(y = \ln \left( {ax} \right)\) What is the effect of increasing \(a\)? It should be a stretch factor \({1 \over a}\), but it looks like a translation. Noting that \(\ln \left( {ax} \right) = \ln \left( x \right) + \ln \left( a \right)\), you can see that the transformation is the same as a translation vertically by \(y = \ln \left( {a} \right)\). When \(a = - 1\), the transformation is a reflection in the \(y\) axis.
This display shows the transformation \(y = \ln \left( {x - b} \right)\) Increasing the value of \(a\) will move the curve to the right.
This display shows the transformations \(y = \ln \left( {{ax} - b} \right)\)
a sin (b x + c) + d Transformations
This display allows you to view transformations of the $\color{blue}{ \sin }$ function.
The original sin function is showed as a green dashed line, and the transformed sin function is shown as a solid blue line. Initially the lines coincide. You can drag green and blue gliders to read coordinates at corresponding points on the original and transformed curves.
The original sin function is showed as a green dashed line, and the transformed sin function is shown as a solid blue line. Initially the lines coincide. You can drag green and blue gliders to read coordinates at corresponding points on the original and transformed curves.
a cos (b x + c) + d Transformations
This display allows you to view transformations of the $\color{blue}{ \cos }$ function.
The original cos function is showed as a green dashed line, and the transformed cos function is shown as a solid blue line. Initially the lines coincide. You can drag green and blue gliders to read coordinates at corresponding points on the original and transformed curves.
The original cos function is showed as a green dashed line, and the transformed cos function is shown as a solid blue line. Initially the lines coincide. You can drag green and blue gliders to read coordinates at corresponding points on the original and transformed curves.
a tan (b x + c) + d Transformations
This display allows you to view transformations of the $\color{blue}{ \tan }$ function.
The original tan function is showed as a green dashed line, and the transformed tan function is shown as a solid blue line. Initially the lines coincide. You can drag green and blue gliders to read coordinates at corresponding points on the original and transformed curves.
The original tan function is showed as a green dashed line, and the transformed tan function is shown as a solid blue line. Initially the lines coincide. You can drag green and blue gliders to read coordinates at corresponding points on the original and transformed curves.
Investigate Order of Transformations 1
This display shows the order in which transformations are applied generally makes a difference.
For $\color{blue}{f(x) = ( a \, \sin ( x ) ) + d }$ the vertical stretch (factor $\color{purple}{ a }$) is applied before the vertical translation (of $\color{purple}{ d }$).
For $\color{red}{g(x) = a \, ( \sin ( x ) + d ) }$ the vertical translation (of $\color{purple}{ d }$) is applied before the vertical stretch (factor $\color{purple}{ a }$).
You can drag a glider on the x-axis to help read cooordinates at corresponding sample points.
Investigate Order of Transformations 2
This display shows the order in which transformations are applied generally makes a difference.
For $\color{blue}{f(x) = \sin ( ( b \, x ) + c ) }$ the horizontal translation (of $\color{purple}{ - c }$) is applied before the horizontal stretch (factor $\color{purple}{ { 1 \over b } }$).
For $\color{red}{g(x) = \sin ( b ( x + c ) ) }$ the the horizontal stretch (factor $\color{purple}{ { 1 \over b } }$) is applied before the horizontal translation (of $\color{purple}{ - c }$).
These orders may seem counter-intuitive if considering 'BIDMAS' precedence.
You can drag a glider on the x-axis to help read cooordinates at corresponding sample points.