

Edexcel 9MA0/01 Jun 2022 A2 Exam Q. 1 : 4 marks in 4:48 min.
Edexcel 9MA0/02 Jun 2022 A2 Exam Q. 1 : 4 marks in 4:48 min.
Edexcel 8MA0/01 Jun 2022 AS Mock Q. 16 : 10 marks in 12:00 min.
Edexcel 8MA0/01 Jun 2022 AS Exam Q. 7 : 7 marks in 8:24 min.
Edexcel 9MA0/01 Dec 2021 A2 Mock Q. 10 a : 2 marks in 2:24 min.
Edexcel 9MA0/02 Nov 2021 A2 Exam Q. 11 : 10 marks in 12:00 min.
Edexcel 9MA0/02 Oct 2020 A2 Exam Q. 11 : 7 marks in 8:24 min.
Edexcel 9MA0/01 Oct 2020 A2 Exam Q. 8 : 2 marks in 2:24 min.
Edexcel 8MA0/01 Oct 2020 AS Exam Q. 9 ab : 3 marks in 3:36 min.
Edexcel 9MA0/01 Oct 2020 A2 Exam Q. 9 bc : 6 marks in 7:12 min.
Edexcel 9MA0/01 Mar 2020 A2 Mock Q. 10 : 8 marks in 9:36 min.
Edexcel 9MA0/02 Mar 2020 A2 Mock Q. 8 : 9 marks in 10:48 min.
Edexcel 9MA0/01 Mar 2020 A2 Mock Q. 8 a : 2 marks in 2:24 min.
Edexcel 9MA0/01 Jun 2019 A2 Exam Q. 13 a : 3 marks in 3:36 min.
Edexcel 9MA0/01 Jun 2019 A2 Shadow Exam Q. 13 a : 3 marks in 3:36 min.
Edexcel 9MA0/01 Jun 2019 A2 Shadow Exam Q. 5 : 10 marks in 12:00 min.
Edexcel 9MA0/01 Jun 2019 A2 Exam Q. 5 : 10 marks in 12:00 min.
Edexcel 8MA0/01 Jun 2019 AS Exam Q. 7 : 8 marks in 9:36 min.
Edexcel 9MA0/02 Jan 2019 A2 Mock Q. 11 b : 4 marks in 4:48 min.
Edexcel 9MA0/02 Jan 2019 A2 Mock Q. 5 : 5 marks in 6:00 min.
Edexcel 9MA0/02 Jun 2018 A2 Exam Q. 3 b : 3 marks in 3:36 min.
Edexcel 9MA0/02 May 2018 A2 Mock Q. 4 : 6 marks in 7:12 min.
Edexcel 8MA0/01 Jun 2017 AS Sample Exam Q. 13 : 7 marks in 8:24 min.
Edexcel 9MA0/02 May 2017 A2 Sample Exam Q. 11 : 6 marks in 7:12 min.
Edexcel 9MA0/01 May 2017 A2 Sample Exam Q. 15 b : 4 marks in 4:48 min.
Using modulus functions

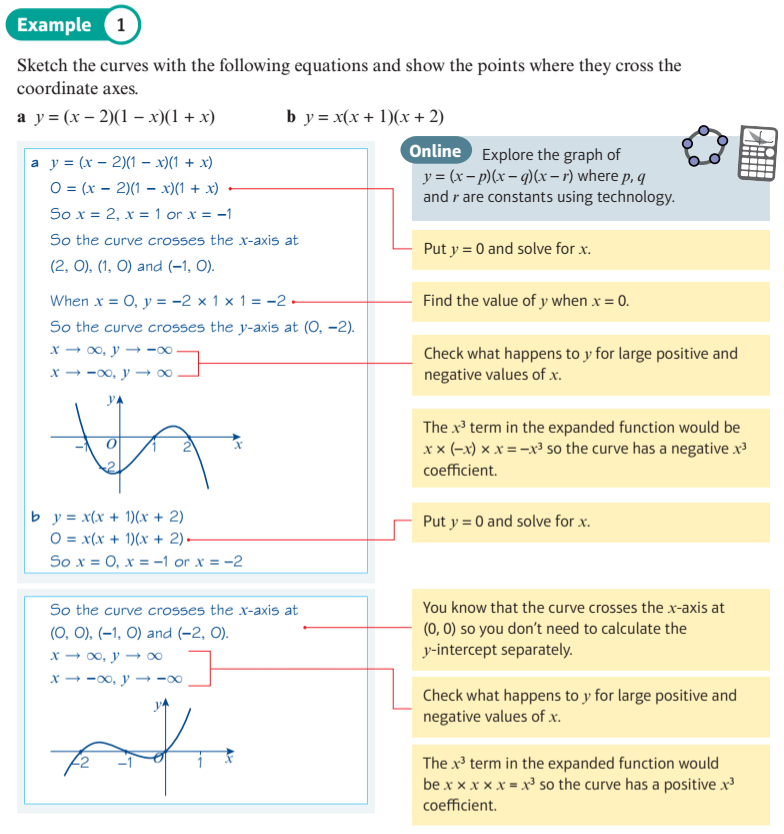
Explore the roots and intercepts of cubic graphs

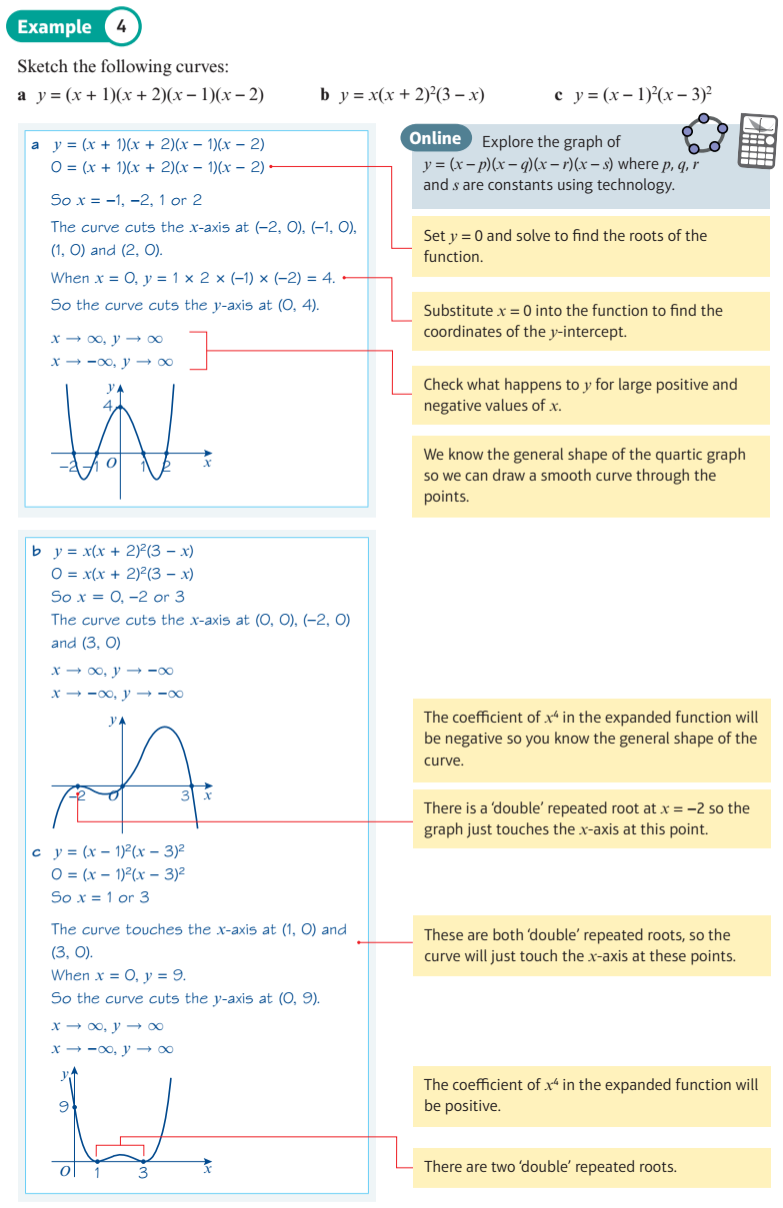
Explore the roots and shapes of quartic functions

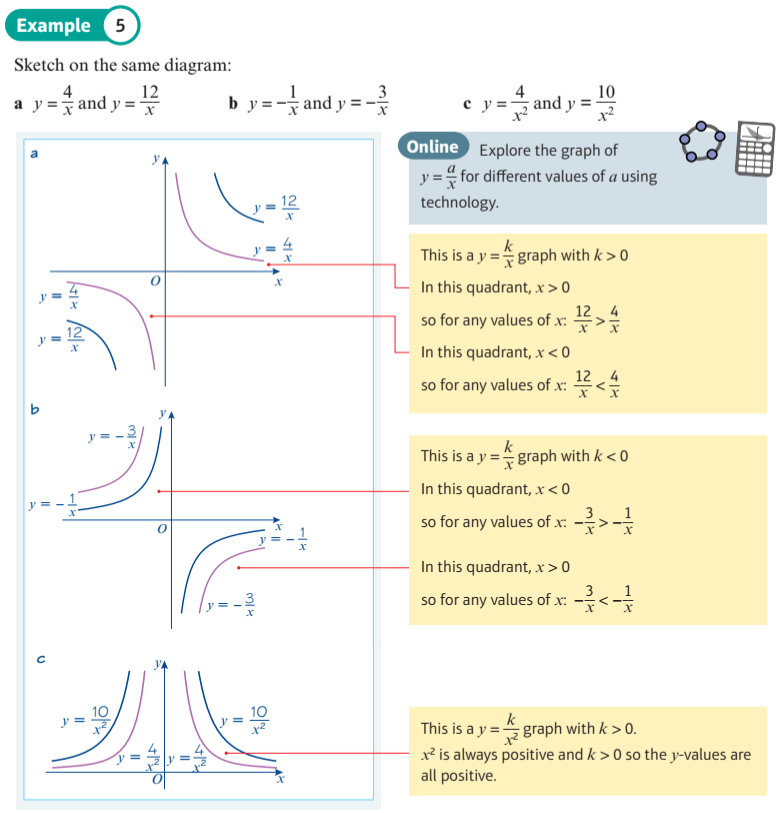
Explore reciprocal graphs

Explore translations of a graph

Explore stretches of a cubic graph

Explore transformations of exponential function
The modulus function
Intersections of straight lines and modulus graphs
Explore modulus transformations
Explore combined tranformations of logarithms
Explore the solution to an inequality of a modulus function.

Matching Polynomials
You can select ten green polynomial curves on this page.
Selecting the order of the curve, and using the sliders to match the blue dashed curve to the green curve will reveal the equation in each case, but can you say what the equation is before making the match?
Coordinate Geometry - Rational Curves - y=(x-a)/(x-b)
The graph of $\color{blue}{y = { {x - a} \over {x - b} } }$
Change the values of $\color{blue}{a}$ and $\color{blue}{b}$ and observe the effect this has on the curve and its asymptotes.
Coordinate Geometry - Asymptotes - Asymptotes of y=a/(x-b)
An asymptote is a line towards which a given curve is approaching but never meets. Asymptotes are often vertical or horizontal lines, but can also be at an angle.
The graph displayed is described by the Cartesian equation: $\color{blue}{y = {{a} \over {x - b}}}$.
Change the values of $\color{blue}{a}$ and $\color{blue}{b}$ and observe the effect this has on the curve and its asymptotes. What are the equations of these asymptotes?
The graph displayed is described by the Cartesian equation: $\color{blue}{y = {{a} \over {x - b}}}$.
Change the values of $\color{blue}{a}$ and $\color{blue}{b}$ and observe the effect this has on the curve and its asymptotes. What are the equations of these asymptotes?
Odd and Even Functions
Functions with the property that f(-a) = f(a) for all values of a are called even.
Functions with the property that f(-a) = -f(a) for all values of a are called odd.
Drag the sample point to help decide whether each of the 10 functions given below are odd, even or neither.
What geometric properties do odd and even functions have?
Functions with the property that f(-a) = -f(a) for all values of a are called odd.
Drag the sample point to help decide whether each of the 10 functions given below are odd, even or neither.
What geometric properties do odd and even functions have?
Transformation: y = a f(x)
For each example, investigate the effect on the graph of y = af(x) of changing 'a'.
A transformation may look like a rotation, but the draggable green point, shows they are all, in fact, stretches away from the x-axis by a factor of a.
What is the effect of making a = -1, so y = -f(x) ?
A transformation may look like a rotation, but the draggable green point, shows they are all, in fact, stretches away from the x-axis by a factor of a.
What is the effect of making a = -1, so y = -f(x) ?
Transformation: y = f(x + a)
For each example, investigate the effect on the graph of y = f(x + a) of changing 'a'.
The green sample points show how graphs are translated horizontally in the opposite direction to what you might expect.
Transformation: y = f(x - a)
For each example, investigate the effect on the graph of y = f(x - a) of changing 'a'.
The green sample points show how graphs are translated horizontally.
Transformation: y = f(x) + a
For each example, investigate the effect on the graph of y = f(x) + a of changing 'a'.
You can drag the green point, and then use the slider to see the effect of the transformation on that particular point.
Transformation: y = f(a x)
For each example, investigate the effect on the graph of y = f(ax) of changing 'a'.
The green sample points show how graphs expand or contract horizontally in the opposite directions to what you might expect.
What is the effect of making a = -1, so y = f(-x) ?
The green sample points show how graphs expand or contract horizontally in the opposite directions to what you might expect.
What is the effect of making a = -1, so y = f(-x) ?
Exponential and Log Combined Transformations
Two transformations of \(y = f\left( x \right)\) are considered: \(y = f\left( {ax} \right)\) and \(y = f\left( {x - b} \right)\) , together with their combination.
This display shows the transformation \(y = \ln \left( {ax} \right)\) What is the effect of increasing \(a\)? It should be a stretch factor \({1 \over a}\), but it looks like a translation. Noting that \(\ln \left( {ax} \right) = \ln \left( x \right) + \ln \left( a \right)\), you can see that the transformation is the same as a translation vertically by \(y = \ln \left( {a} \right)\). When \(a = - 1\), the transformation is a reflection in the \(y\) axis.
This display shows the transformation \(y = \ln \left( {x - b} \right)\) Increasing the value of \(a\) will move the curve to the right.
This display shows the transformations \(y = \ln \left( {{ax} - b} \right)\)
Investigate Modulus Inequalities 1
The modulus inequality $ { a \, { x ^ 2 } + b \, x + c > \left| \, d \, x + e \, \right| } $ can be investigated in this display.
$\color{blue}{ f(x) = a \, { x ^ 2 } + b \, x + c }$ is shown in blue and $\color{red}{g(x) = \left| \, d \, x + e \, \right| }$ is shown in red.
The solution is values of $x$ for which $\color{blue}{f(x)}$ lies above $\color{red}{g(x)}$.
$\color{blue}{ f(x) = a \, { x ^ 2 } + b \, x + c }$ is shown in blue and $\color{red}{g(x) = \left| \, d \, x + e \, \right| }$ is shown in red.
The solution is values of $x$ for which $\color{blue}{f(x)}$ lies above $\color{red}{g(x)}$.
Investigate Modulus Inequalities 2
The solutions to quadratic modulus inequalities like $\color{green}{\left| \, a \, {x^2} + b \, x + c \, \right| > d \, x + e}$ can be illustrated graphically.
Both the curve $\color{blue}{y = \left| \, a \, {x^2} + b \, x + c \, \right|}$ and the line $\color{red}{y = d \, x + e}$ are plotted, and the inequality holds where the modulus of the curve lies above the line.
The solution is shown on the number line at the bottom. Note that the solution is itself an inequality, but in terms of just x. Note also, that intersection points are shown as open circles on the number line, because they are not included in the solution.
a sin (b x + c) + d Transformations
This display allows you to view transformations of the $\color{blue}{ \sin }$ function.
The original sin function is showed as a green dashed line, and the transformed sin function is shown as a solid blue line. Initially the lines coincide. You can drag green and blue gliders to read coordinates at corresponding points on the original and transformed curves.
a cos (b x + c) + d Transformations
This display allows you to view transformations of the $\color{blue}{ \cos }$ function.
The original cos function is showed as a green dashed line, and the transformed cos function is shown as a solid blue line. Initially the lines coincide. You can drag green and blue gliders to read coordinates at corresponding points on the original and transformed curves.
a tan (b x + c) + d Transformations
This display allows you to view transformations of the $\color{blue}{ \tan }$ function.
The original tan function is showed as a green dashed line, and the transformed tan function is shown as a solid blue line. Initially the lines coincide. You can drag green and blue gliders to read coordinates at corresponding points on the original and transformed curves.
Investigate Order of Transformations 1
This display shows the order in which transformations are applied generally makes a difference.
For $\color{blue}{f(x) = ( a \, \sin ( x ) ) + d }$ the vertical stretch (factor $\color{purple}{ a }$) is applied before the vertical translation (of $\color{purple}{ d }$).
For $\color{red}{g(x) = a \, ( \sin ( x ) + d ) }$ the vertical translation (of $\color{purple}{ d }$) is applied before the vertical stretch (factor $\color{purple}{ a }$).
You can drag a glider on the x-axis to help read cooordinates at corresponding sample points.
Investigate Order of Transformations 2
This display shows the order in which transformations are applied generally makes a difference.
For $\color{blue}{f(x) = \sin ( ( b \, x ) + c ) }$ the horizontal translation (of $\color{purple}{ - c }$) is applied before the horizontal stretch (factor $\color{purple}{ { 1 \over b } }$).
For $\color{red}{g(x) = \sin ( b ( x + c ) ) }$ the the horizontal stretch (factor $\color{purple}{ { 1 \over b } }$) is applied before the horizontal translation (of $\color{purple}{ - c }$).
These orders may seem counter-intuitive if considering 'BIDMAS' precedence.
You can drag a glider on the x-axis to help read cooordinates at corresponding sample points.