
Selected: Edexcel A Level Maths - Pure Maths
AS & A2 (Whole Course) - All Questions - Casio fx-991EX
Register / Login for More / Subscribe for All Without Ads
AS & A2 (Whole Course) - All Questions - Casio fx-991EX
Register / Login for More / Subscribe for All Without Ads


Finding value of 1st derivative at given point
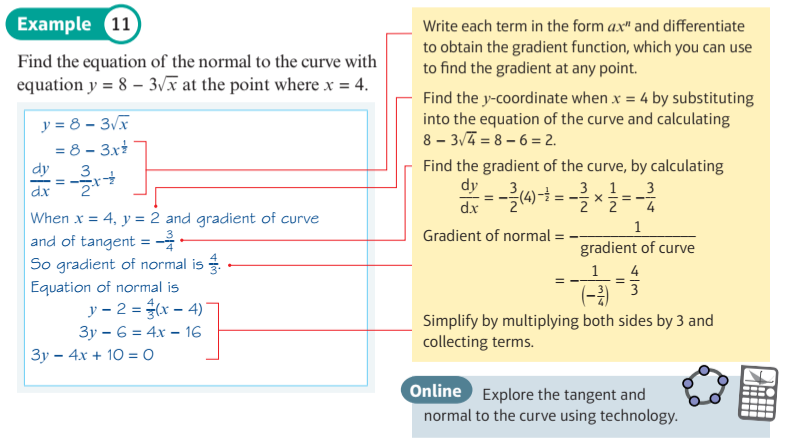
Explore tangent and normal to curve
Explore where function is increasing and decreasing
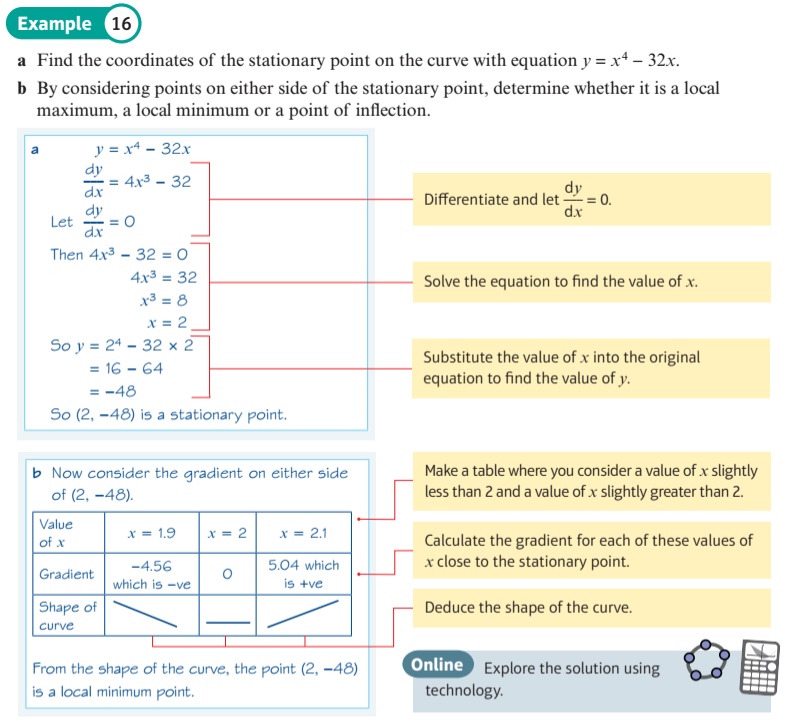
Explore a stationary point
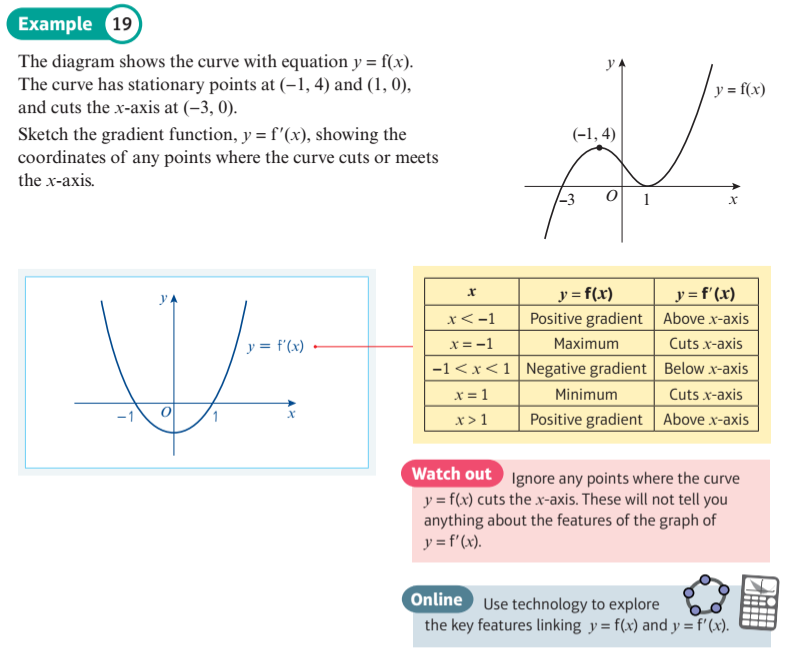
Explore key features linking function and derivative
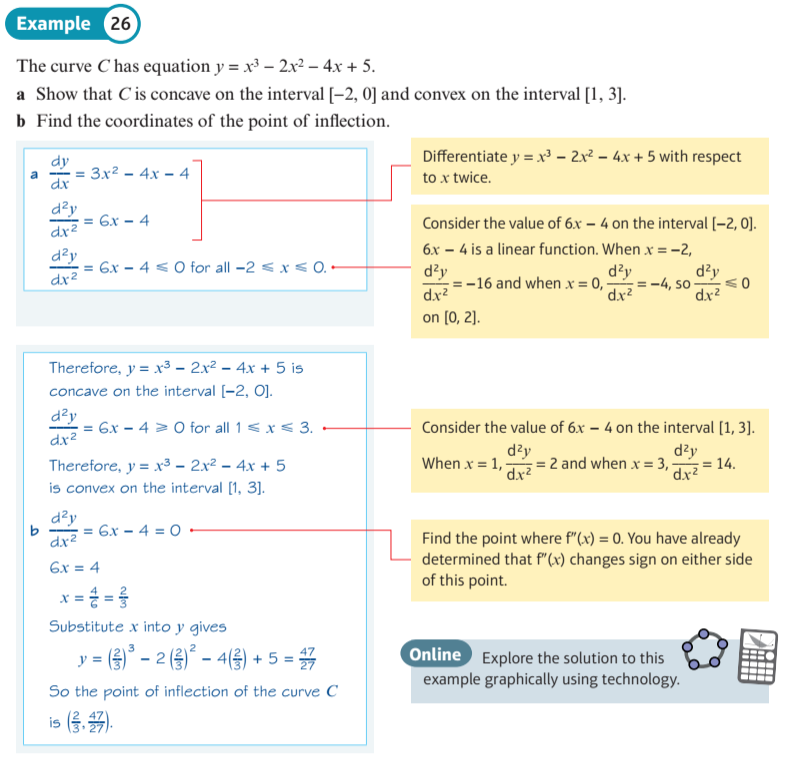
Exploring second derivatives
Differentiating Quadratics
At any point on a curve, a line can be drawn that just touches the curve at that point.
Such a line is called a tangent. This tangent line will have a gradient.
Drag the red point in the display below to move the tangent line along the quadratic graph, and see how the gradient changes.
You can see that the gradient function f'(x) of a quadratic curve is a straight line.
Drag the red point in the display below to move the tangent line along the quadratic graph, and see how the gradient changes.
You can see that the gradient function f'(x) of a quadratic curve is a straight line.
Differentiating Cubics
At any point on a curve, a line can be drawn that just touches the curve at that point.
Such a line is called a tangent. This tangent line will have a gradient.
Drag the red point in the display below to move the tangent line along the cubic graph, and see how the gradient changes.
You can see that the gradient function f'(x) of a cubic curve is a quadratic curve.
Drag the red point in the display below to move the tangent line along the cubic graph, and see how the gradient changes.
You can see that the gradient function f'(x) of a cubic curve is a quadratic curve.
Differentiating Quartics and Higher Order
Drag the red point in the display below to move the tangent line along the quartic (fourth order) curve.
You can see that the gradient function f'(x) of a quartic curve is a cubic curve.
Finally you can investigate higher order curves. In each case, the gradient function f'(x) will be a curve of one order lower.
You can see that the gradient function f'(x) of a quartic curve is a cubic curve.
Finally you can investigate higher order curves. In each case, the gradient function f'(x) will be a curve of one order lower.
Gradients of Polynomials Including Negative Indices
Use this display to investigate the gradient functions of your own polynomials.
You can also set coefficients of negative indices \(x^{-1}\), \(x^{-2}\) and \(x^{-3}\).
Drag the red sample point to help you investigate.
You can also set coefficients of negative indices \(x^{-1}\), \(x^{-2}\) and \(x^{-3}\).
Drag the red sample point to help you investigate.
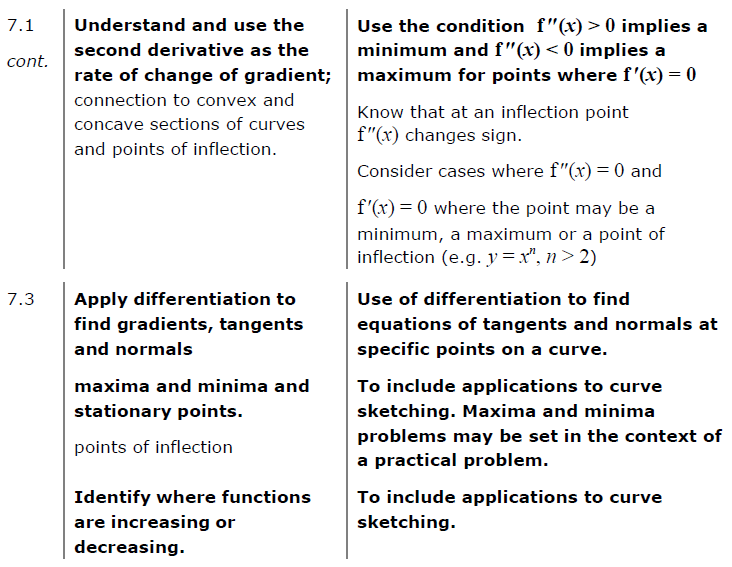
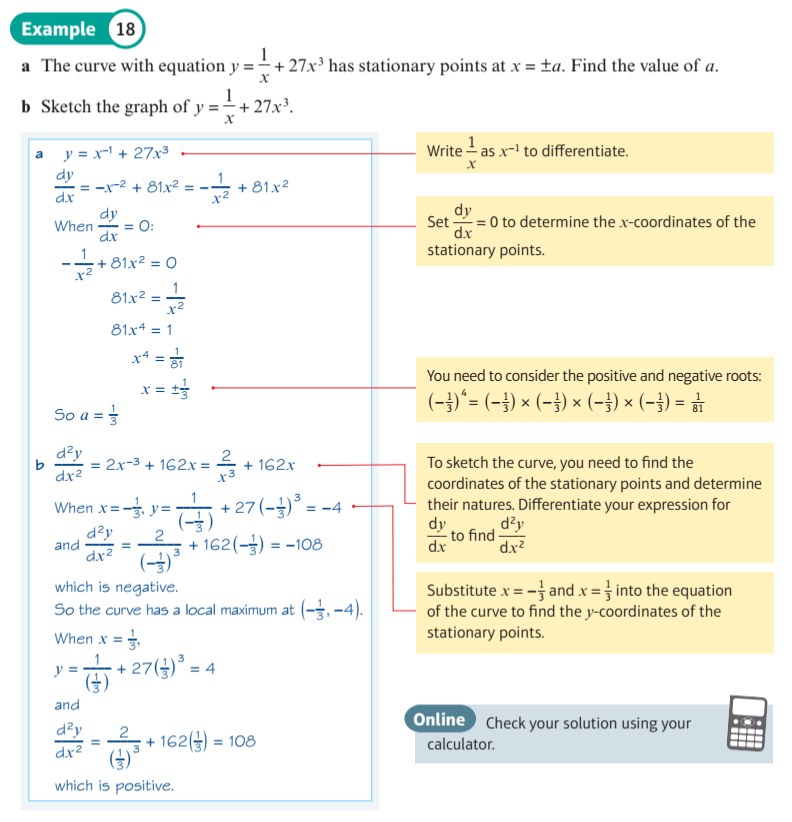
Stationary Points - Maxima and Minima
Look carefully at the points on the graph of y = f(x) where the curve becomes horizontal.
What is the value of f'(x) at these points?
These points are called stationary points. The "top of the hill" of the curve is called a maximum point. The "bottom of the valley" of the curve is called a minimum point.
You can drag the blue sample point to help you investigate.
These points are called stationary points. The "top of the hill" of the curve is called a maximum point. The "bottom of the valley" of the curve is called a minimum point.
You can drag the blue sample point to help you investigate.
Stationary Points - Maxima and Minima
Tangent and normal lines to the graph of $y = f(x)$ are displayed in green and red respectively.
A sample point, which you can drag to help investigate, is displayed in blue.
Look carefully at the points where the curve becomes horizontal. What is the value of x at these points? These points are called stationary points. The "top of the hill" of the curve is called a maximum point. The "bottom of the valley" of the curve is called a minimum point.
Can you find those points where the gradient is at its greatest? And where the gradient is at its smallest?
Points of Inflection
Look carefully at the points on the graph of y = f(x) where the curve becomes horizontal.
f'(x) = 0 at these points. Many of these stationary points are either maximum or minimum points,
but there are a few that are neither, for example at x = -1.57 and 4.71.
These are called points of inflexion.
You can drag the blue sample point to help you investigate.
In the display below the graph of y = f(x) is shown for polynomial functions, together with the graphs of y = f'(x) and y = f''(x).
f(x) is initialised to $y = {\left( {x + 1} \right)^3} + 3$ $(= {x^3} - 3{x^2} + 3x + 2)$
This curve has a point of inflexion at x = 1. What are the values of f'(x) and f''(x) at this point?
Once again, you can drag the blue sample point to help you investigate. You can then check your findings with curves of your own.
Differentiating ${e^x}$ and ${ln (x)}$
Use this display to investigate f(x) and f'(x) for ${e^x}$ and ${ln (x)}$.
You can change f(x) with the sliders and drag the red sample point.
You can change f(x) with the sliders and drag the red sample point.
Investigate Differentiation of ${ln (ax)}$
Use this display to investigate the gradient, ie derivative, of $\color{blue}{ f(x) = \ln \left( a \, x \right) }$,
as a changes.
as a changes.
An Increasing Function
The function $f\left( x \right) = {x^3} + x$ is always increasing. You can see that its gradient is never negative.
The function $f\left( x \right) = {x^3}$ has a gradient of zero at $x = 0$
The function $f\left( x \right) = {x^3}$ has a gradient of zero at $x = 0$
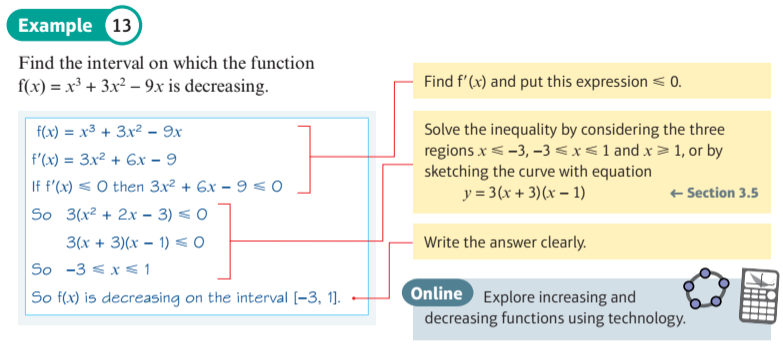
A Decreasing Function
The function \(f\left( x \right) = 1 - x - {x^3}\) is always decreasing; its gradient is always negative.
Increasing or Decreasing?
Identify which of the following 10 curves show increasing or decreasing functions, or neither.
Strictly Increasing/Decreasing Functions
This display shows the difference between increasing/decreasing and strictly increasing/decreasing functions.
The gradient of $f(x) = {x^3} + 1$ is 0 at $x = 0$, but it is still strictly increasing at this point, because to the left $f(x)$ is less, and to the right $f(x)$ is more ($\forall a,b:a < b \Rightarrow f(a) < f(b)$).
The gradient of $f(x) = - {x^3} + 1$ is 0 at $x = 0$, but it is still strictly decreasing at this point, because to the left $f(x)$ is more, and to the right $f(x)$ is less ($\forall a,b:a < b \Rightarrow f(a) > f(b)$).
Investigate Trig Differentiation
This display allows you to investigate the first and second derivatives of standard trigonometric functions.
The graph of the first derivative is shown in red and the graph of the second derivative is in purple.
The x-slider allows you to run along the curves to see correpondence at a single point.
Can you see how the derivative of sin is cos?
Can you see how the derivative of cos is -sin?
Can you see how the derivative of tan is sec2?
Derivatives of Inverses arcsin, arccos, arctan
This display allows you to investigate the derivatives of the inverse trigonometric functions $\color{blue}{\arcsin (x)}$, $\color{blue}{\arccos (x)}$ and $\color{blue}{\arctan (x)}$.