
Selected: Edexcel A Level Maths - Pure Maths
AS & A2 (Whole Course) - All Questions - Casio fx-991EX
Register / Login for More / Subscribe for All Without Ads
AS & A2 (Whole Course) - All Questions - Casio fx-991EX
Register / Login for More / Subscribe for All Without Ads

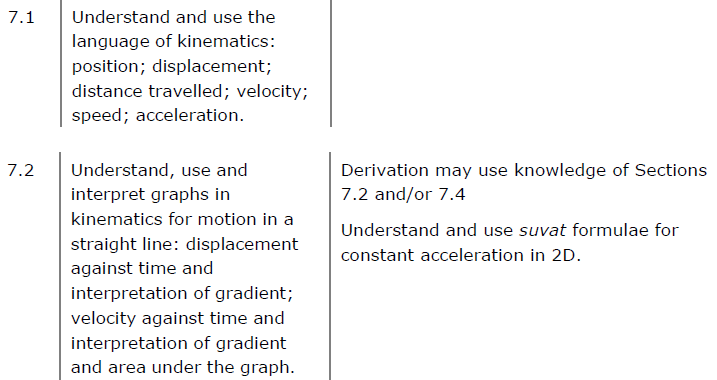
Velocity Time Graph
Investigate Velocity-Time Graph
The display below shows velocity plotted against time.
The motion has three stages:
1. The particle travels from rest with constant accleration.
2. The particle travels at a constant velocity for a period.
3. The particle slows to rest with constant deceleration.
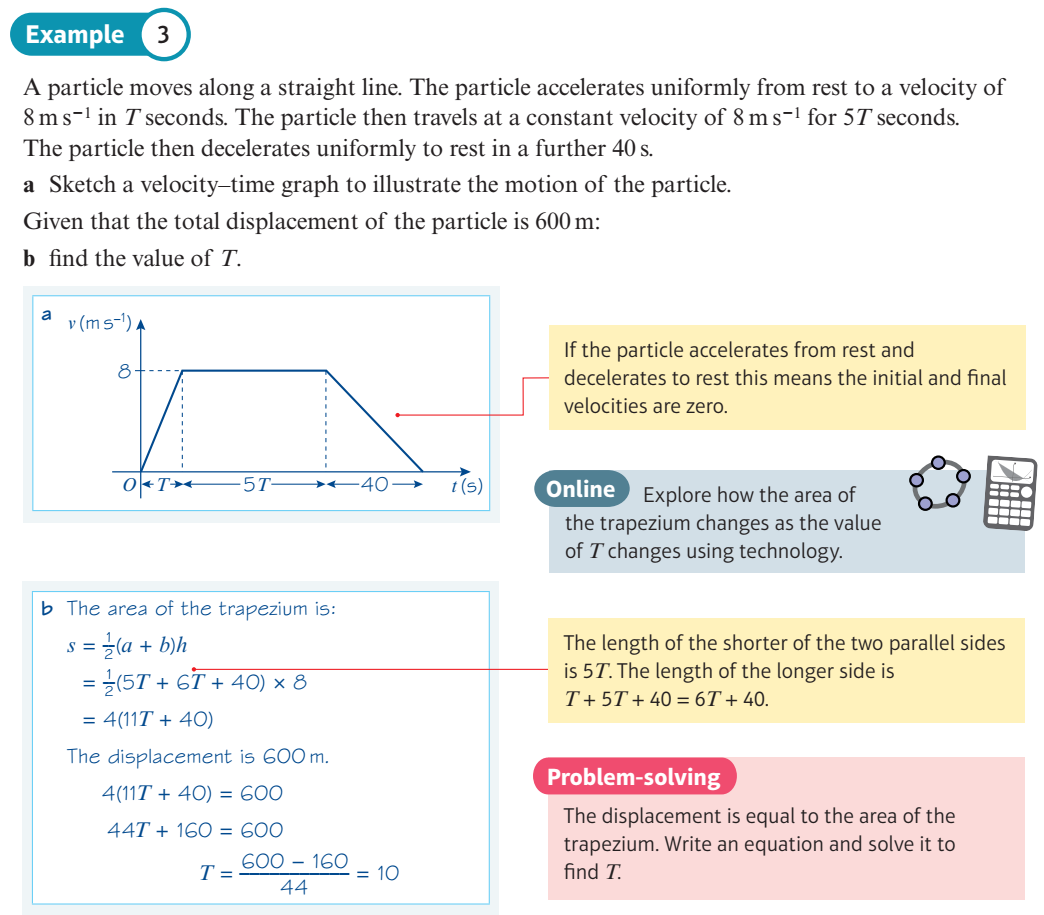
The accleration and deceleration can be adjusted with the sliders, and the times at which the particle stops accelerating and starts decelerating can also be adjusted by dragging the points on the TIME-axis.
Find the total time taken and distance travelled in these cases:
When acceleration = 5 m s-1 for 4 seconds and 5 seconds later deceleration is -4 m s-1 .
When acceleration = 8 m s-1 for 3 seconds and 4 seconds later deceleration is -10 m s-1 .
1. The particle travels from rest with constant accleration.
2. The particle travels at a constant velocity for a period.
3. The particle slows to rest with constant deceleration.
The accleration and deceleration can be adjusted with the sliders, and the times at which the particle stops accelerating and starts decelerating can also be adjusted by dragging the points on the TIME-axis.
Find the total time taken and distance travelled in these cases:
When acceleration = 5 m s-1 for 4 seconds and 5 seconds later deceleration is -4 m s-1 .
When acceleration = 8 m s-1 for 3 seconds and 4 seconds later deceleration is -10 m s-1 .