
Selected: Edexcel A Level Maths - Pure Maths
AS & A2 (Whole Course) - All Questions - Casio fx-991EX
Register / Login for More / Subscribe for All Without Ads
AS & A2 (Whole Course) - All Questions - Casio fx-991EX
Register / Login for More / Subscribe for All Without Ads

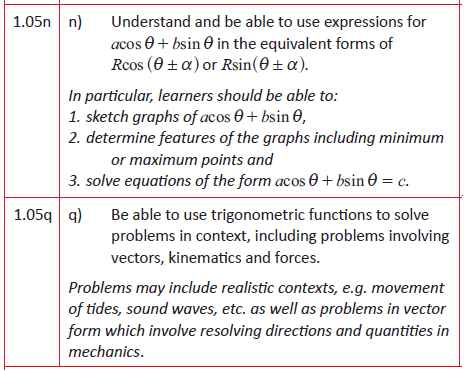
Explore transforming trigonometric graphs for modelling
Explore maxima and minima of trigonometric curves
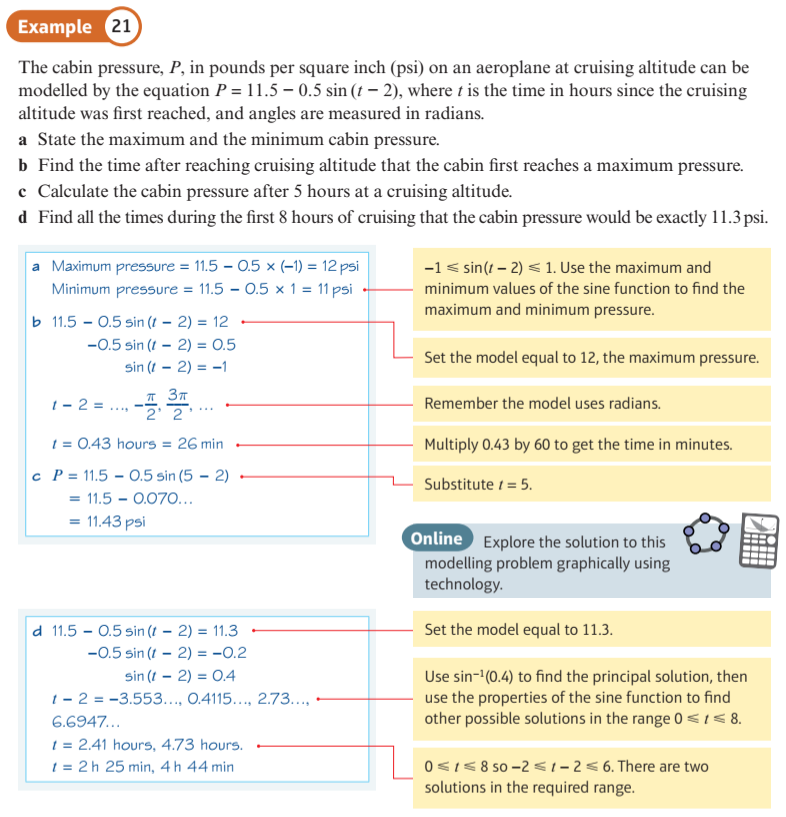
Trig Applications: Page 189, Example 21
Visualise a sin x ${ \pm }$ b cos x to sin
This display allows you to visualise the transformations:
$\color{purple}{ a \, \sin (x) + b \, \cos (x) = R \, \sin (x + \alpha) }$
$\color{purple}{ a \, \sin (x) - b \, \cos (x) = R \, \sin (x - \alpha) }$
After adjusting $\color{red}{a}$ and $\color{blue}{b}$, you can adjust $\color{green}{r}$ and $\color{green}{\alpha}$ to their derived values to see the two curves coincide.
For a better view, you should use the navigation buttons in the lower right corner to zoom in and out.
Visualise a cos x ${ \pm }$ b sin x to cos
This display allows you to visualise the transformations:
$\color{purple}{ a \, \cos (x) + b \, \sin (x) = R \, \cos (x - \alpha) }$
$\color{purple}{ a \, \cos (x) - b \, \sin (x) = R \, \cos (x + \alpha) }$
After adjusting $\color{red}{a}$ and $\color{blue}{b}$, you can adjust $\color{green}{r}$ and $\color{green}{\alpha}$ to their derived values to see the two curves coincide.
For a better view, you should use the navigation buttons in the lower right corner to zoom in and out.