
Selected: Edexcel A Level Maths - Pure Maths
AS & A2 (Whole Course) - All Questions - Casio fx-991EX
Register / Login for More / Subscribe for All Without Ads
AS & A2 (Whole Course) - All Questions - Casio fx-991EX
Register / Login for More / Subscribe for All Without Ads


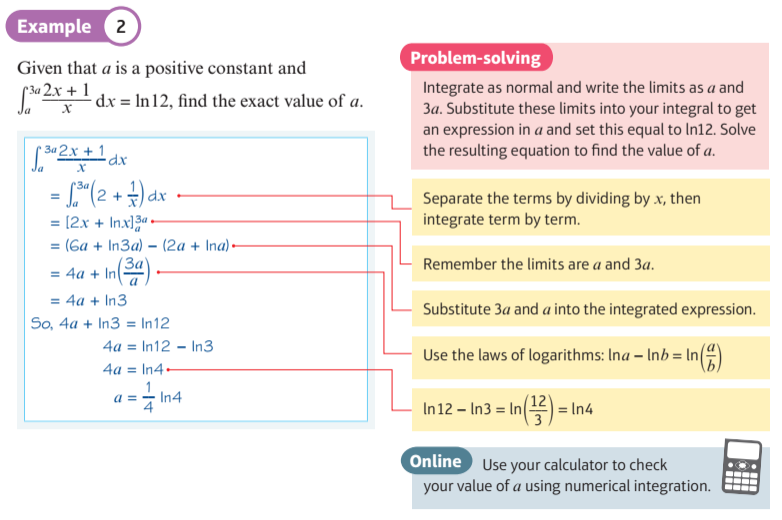
Checking answers with numerical integration
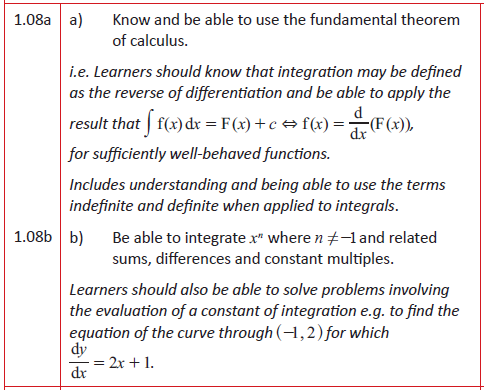
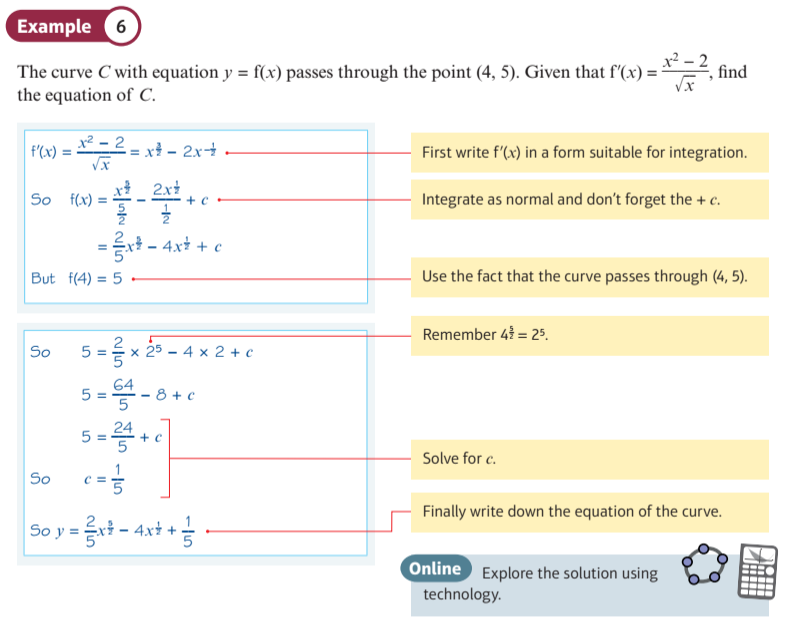
Determining the constant of integration
Investigate Integration of ${e^{ax}}$
This display allows you to visualise the integration of $\color{blue}{ { e ^ { \, a \, x } } }$ or $\color{blue}{ { e ^ { \, x } } }$ when a = 1.
The graph of the exponential function is shown in blue and the graph of the integral is in green.
The a-slider allows you to adjust the exponential function and the c-slider allows you to adjust the constant of integration in its integral.
The x-slider allows you to run along the curves to see correpondence at a single point.
Investigate Integration of ${ 1 \over { ax } }$
This display allows you to visualise the integration of $\color{blue}{ { 1 \over { a \, x } } }$ or $\color{blue}{ { 1 \over x } }$ when a = 1.
The graph of the reciprocal function is shown in blue and the graph of the integral is in green.
The a-slider allows you to adjust the exponential function and the c-slider allows you to adjust the constant of integration in its integral.
The x-slider allows you to run along the curves to see correpondence at a single point.
Investigate Trig Integration
This display allows you to visualise some trigonometric integrals.
The graph of the trigonometric function is shown in blue and the graph of the integral is in green.
The k-slider allows you to adjust the trigonometric function and the c-slider allows you to adjust the constant of integration in its integral.
The x-slider allows you to run along the curves to see correpondence at a single point.